-
Tips for becoming a good boxer - November 6, 2020
-
7 expert tips for making your hens night a memorable one - November 6, 2020
-
5 reasons to host your Christmas party on a cruise boat - November 6, 2020
-
What to do when you’re charged with a crime - November 6, 2020
-
Should you get one or multiple dogs? Here’s all you need to know - November 3, 2020
-
A Guide: How to Build Your Very Own Magic Mirror - February 14, 2019
-
Our Top Inspirational Baseball Stars - November 24, 2018
-
Five Tech Tools That Will Help You Turn Your Blog into a Business - November 24, 2018
-
How to Indulge on Vacation without Expanding Your Waist - November 9, 2018
-
5 Strategies for Businesses to Appeal to Today’s Increasingly Mobile-Crazed Customers - November 9, 2018
Satellite Pictures, Data Help Scientists Predict Poverty In Hard To Reach Areas
Locating people living in poverty, such as through door-to-door surveys, sometimes is hard. The availability of accurate and reliable information on the location of impoverished zones is sorely lacking, which forces aid groups and other global organizations to conduct door-to-door surveys to supplement existing data – an expensive and time-consuming process.
Advertisement
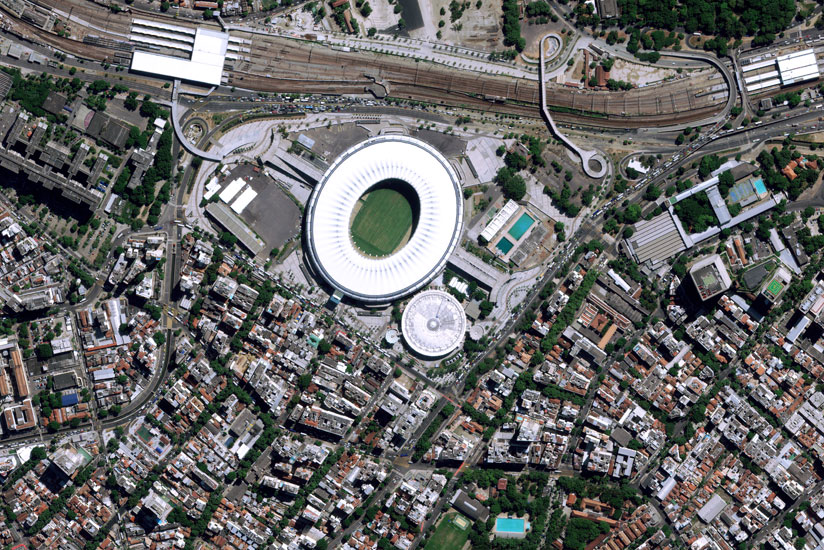
Those are the opening words on the website of Stanford University’s Sustainability and Artificial Intelligence Lab, and its researchers have come up with an unusual – and effective – way to map and predict the distribution of poverty; their method combines high-resolution satellite imagery with machine learning. In this case, the researchers built on earlier machine learning methods to find impoverished areas across five African countries.
Dr Burke added, “We traditionally collect poverty data through household surveys. we send survey enumerators around to houses and we ask lots of questions about income, consumption-what they’ve bought in the past year – and we use that data to construct our poverty measures”. “At the same time, we collect all sorts of other data in these areas – like satellite imagery – constantly”. Studies have indicated that space-based data that captures night lights can also be used to predict wealth in a particular area.
Jean says there are a few places in the world where the computer can tell whether the people were poor or rich, making it hard to extract information from the amount of available daytime satellite imagery.
What’s challenging was that although standard machine learning can work when they access large chunks of data, in this case, there was little data about poverty to begin with.
The computer was asked to use the data to spot signs of poverty in a separate set of high-resolution daytime satellite images that contain information from poor regions that otherwise appear dark in night photos. They used the “nightlight” data to identify features in the higher-resolution daytime imagery that are correlated with economic development since the areas that are brighter at night are usually more developed.
The researchers then developed a sophisticated learning algorithm that categorizes these features and found that this method did a surprisingly good job predicting the distribution of poverty. These improved poverty maps could help aid organizations and policymakers distribute funds more efficiently and enact and evaluate policies more effectively.
“Our paper demonstrates the power of machine learning in this context”, says Stefano Ermont, co-author of the study and a computer science assistant professor.
Advertisement
The research team, which consisted of Marshall Burke, Neal Jean and colleagues said the technique could be used to monitor and address poverty in developing countries across the world.


